Keywords: Socre function, Loss function, Bias trick, SVM classifier, Softmax classifier
Image classification of parametric approach has two major components:
- Score function: maps the raw data to class scores.
- Loss function: quantifies the agreement between predicted scores and the ground truth labels.
Optimization: minimize the loss function with respect to the parameters of the score function.
Linear Classifier definition:
Score function:
In the above equation, we assume that images Xi has shape [D1], W has shape [KD] and vector b (of size [K1]). In CIFAR-10, Xi has shape [30711], W has shape [103072], and b is [101], so 3072 numbers input into the function and 10 numbers come out.
Notes:
- computed scores match the ground truth labels acros the whole training set. Intuitively, we wish that the correct class has a score that is higher than the scores of incorrect classes.
- this approach is that the training data is used to learn the parameters w and b, but once the learning is complete we can discard the entire training set and only keep the learned parameters. Because a new test image can be simply forward through the function and classified based on the computed scores.
- Classifying a test images involves a single matrix multiplication and addition, which is significantly faster than comparing a test image to all training images.
- Single matrix multiplication Wx is effectively evaluating 10 separate clsssifiers in parallel.
Interpreting a linear classifier
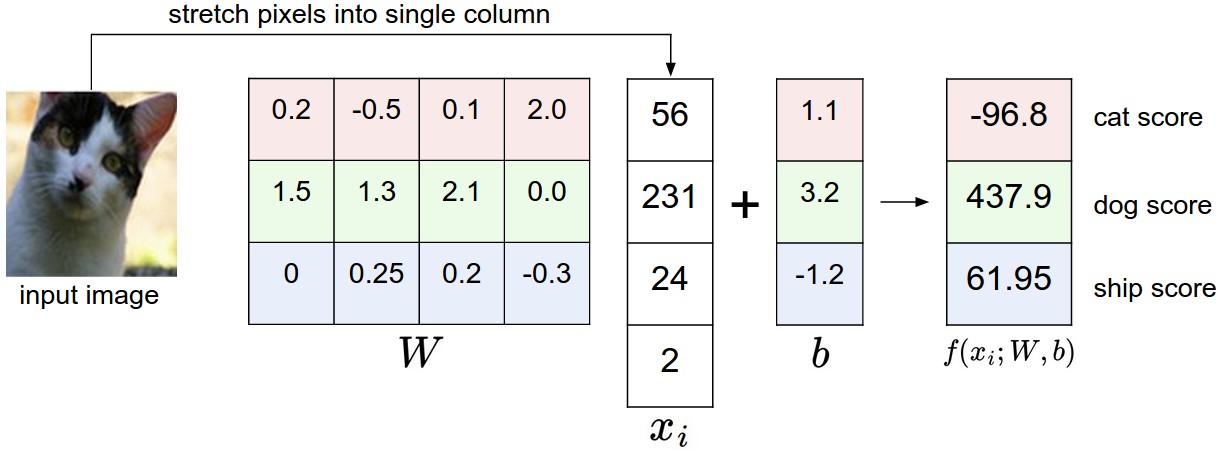
A linear classifier computes the score of a class as a weighted sum of all of its pixel values across all 3 of its color channels. Let’s imagine that the “ship” class might be more likely if there is a lot of blue on the sides of an image. So we expect the “ship” classifier would have a lot of positive weights across its blue channel weights, and negative weights in the red/green channels.
In this image, the scores for each class are not good at all. This set of weights seems vonvinced that it’s looking at a dog.
Analogy of images as high-dimensional points:
In high-dimensional column vectors, we can interpret each image as a single point in this space. Analogously, the entire dataset is a (labeled)set of points.
The geometric interpretation of these numbers is that as we change one of the rows of W, the corresponding line in the pixel space will rotate in different directions.![]()
Interpretation of linear classifiers as template matching:
Another interpretation for the weights W is that each row of W corresponds to a template for one of the classes. The score of each class for an image is obtained by comparing each template with the image using an inner prodict(dot product) one by one to find the best fit.
Additionally, the horse template seems to contain a two-headed horse, which is due to both left and right facing horses in the dataset. The linear classifier merges two modes of horses into a single template.
Similarly, the car classifier seems to have merged serveral modes into a single template. In particular, the template ended up with red, which hints that there are more red cars in CIFAR-10 dataset than of any other color. The linear classifier is too weak to properly account for different-colored cars,but neural networks will allow us to perform this task.
Bias trick:
We defined the score function as:
but now we simplify it as
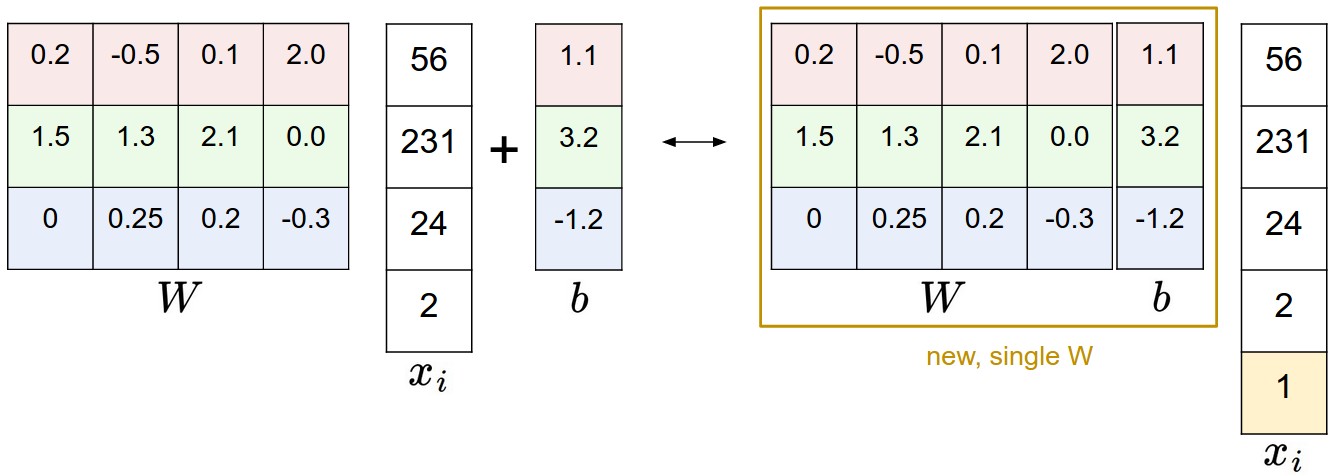
With CIFAR-10 example, X as shape of [30731] instead of [30721], W has shape of [10*3073].The illustration shows:
If we preprocess data by appending ones to all vectors, we only have to learn a single matrix of weights insteads of two matrices that hold weights and biases.
Image data preprocessing:
Pixel values which range from [0:255] is very common to perform normalization of our input features. In particular, it’s important to center data by subtracting the mean from every feature. In the case of images, computing a mean image and subtracing it from every image to get images where the pixels range from approximately [-127, 127]. Further common preprocessing is to scale each input feature so that its values range from [-1,1]. The zero is arguably more important.
Loss function:
Loss function is going to measure our unhappiness with outcomes. Loss function also refered to as the cost function.
Multiclass Support Vector Machine Loss:
It is a commonly used loss. SVM wants to have a score higher than the incorrect classes by some fixed margin.
We first come out the class score and abbreviate to s. The score as:
The Multiclass SVM loss for i-th example is:
If the scores s = [13, -7, 11], and the first class is the true class. Assume the hyperparameter delta is 10. The expression above sums over all incorrect classes:
First gives 0 since [-7-13+10] gives a negative number. The loss outcome is 8. In summary, the SVM loss function wants the score of the correct class to be larger than the incorrect class scores by at least by delta.
In particular, we are working with linear score functions, so we can rewrite loss function:
Wj is the j-th row of W reshaped as a column.
Hinge loss: is max(0,-) function:
Sometimes people instead using squared hinge loss SVM(L2-SVM).
Regularization:
We can do by extending the loss function with a regularization penalty R(W). The most common regularization penalty is the L2 norm:
The complete Multiclass SVM loss, which is made up of two components: data loss and regularization loss:
or
N is the number of training examples. Lambda is a hyperparameter.
The most appealing property is tht penalizing large weights tends to imporve generalization, because it means that no input dimension can have a very large influence on the scores all by itself.
The regularization only works for weights but not for biases.
Softmax classifier:
SVM is one of two commonly seen classifiers. The other one is Softmax classifier.
fi means vector of class scores. Function in parentness is softmax function: it takes a vector of arbirary real-valued scores and squashes it to a vector of values between 0 to 1 that sum to one.
Information theory:

The cross-entropy between a “true” distribution p and an estimated distribution q is defined above.
Softmax classifier is minimizing the cross-entropy between teh estimated class probabilities and the “true” distribution. Additionally, cross-entropy can be written in terms of entropy and Kullback-Leibler divergence as:
Probabilistic interpretation:
The expression as we see:
can be interpreted as the probability assigned to the correct label yi given the image xi and W. In probabilistic interpretation, we are minimizing the negative log likehood of the correct class, which can be interpreted as performing MLE(Maximum Likehood Estimation).
Practical issues:
exponentials might be very large, which can be numerically unstable. Normalization is a useful trick. The expression as we see that:
In common choice, C is to set LogC = -maxj(fj). In code:1
2
3
4
5
6
7import numpy as np
f = np.array([123,456,789])
p = np.exp(f)/np.sum(np.exp(f)) # overflow
f -= np.max(f)
p = np.exp(f)/np.sum(np.exp(f)) # safe to do
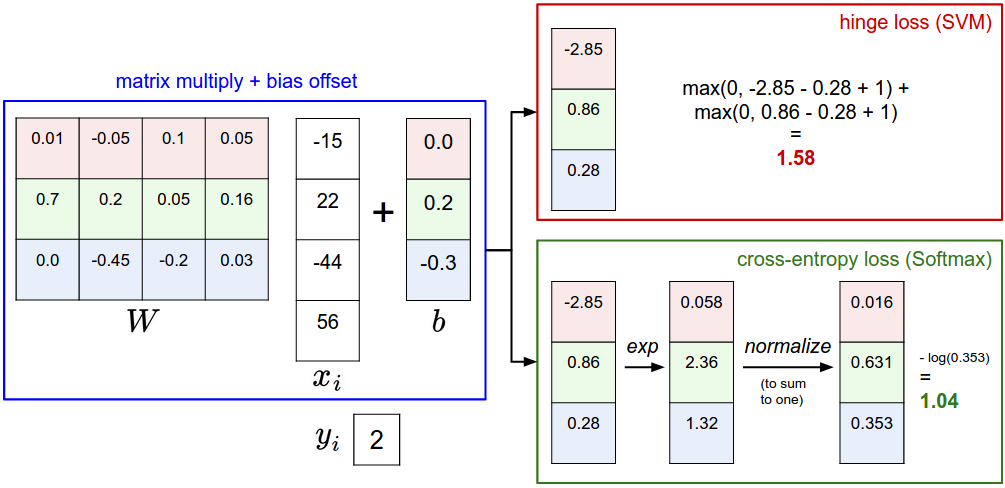
To be precies, SVM classifier uses the hinge loss(max-margin loss). Softmax classifier uses cross-entropy loss, which is used to squash the raw class scores into normalized positive values that sum to one. In particular, note that it doesn’t make sense to talk about “softmax loss”, since softmax is a squashing function.
SVM vs. Softmax:
A picture might help clarify the distinction:
Softmax classifier provides “probabilities” for each class:
Unlike SVM which computes uncalibrated and not easy to interpret scores for all classes, Softmax classifier allows us to compute “probabilities” for all labels. For example:
Unnormalized log-probabilities for three classes come out to be [1,-2,0]. The softmax function would compute:
Now if the regularization strength lambda was higher, W would be penalized more and this would lead to smaller weights. Suppose that weights became [0.5,-1,0]. The softmax would compute:
Practice:
The performance difference between SVM and Softmax are usually very small. Compared to Softmax classifier, SVM is a more local objective. Consider an example that archieves the scores [10,-2,3] and the first class is correct. An SVM (delta=1) will see that the correct class has a score higher than the margin compared to other classes and compute loss of zero. If they were insted [10,-100,-100] or [10,9,9] the SVM would be indifferent since the margin of 1 is satisfied and the loss is zero. The SVM doesn’t care about the details of the individual scores.
In other words, Softmax is nevery fully happy with the scores it produces: the correct class could always have a higher probability and incorrect classes always a lower probability and the loss would always get better. However, the SVM is happy once the margins are satified.